

Biomarker Testing Consolidation and Implementation Using Multiplex Immunofluorescence
Edited by: Cara Digby-Patel
Researchers have always been on the lookout for more predictive biomarkers, particularly for immunotherapy. The search consistently throws up new challenges, particularly because the process has become far more complicated in the era of immunotherapies compared to targeted therapies. This is because multiple biomarkers need to be considered, and these biomarkers are found deep in the tissue microenvironment, not just in cancer cells.
At Oxford Global’s Advancing Biomarker Analysis Europe event in 2021, a senior representative of the Royal Marsden NHS Foundation Trust discussed the possibilities of multiplex immunofluorescence (mIF) as a means to consolidate mIF and immunohistochemistry (IHC) panels.
The Role of Multiplex Immunofluorescence
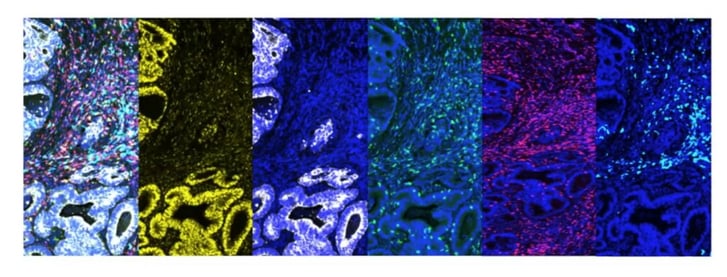
There are several advantages to using mIF. Firstly, using mIF means multiple markers can be used in a single assay. It also allows for both cancer cells and the tumour microenvironment to be looked at on the same slide, meaning that researchers can assess the geospatial information of both at once. In Figure 1, for example, the first image (left) is a merged image of all the signals for all markers, and each subsequent image shows a single marker: the second and third are cancer-specific, whilst the fourth, fifth, and sixth are markers which are looking into the immune cells of the microenvironment.
Depending on the power applied, mIF permits both simple and complex phenotype specifications. For example, compared to a singleplex assay that may only confirm CD4 positivity, mIF could specify the cell as CD4+FOXP3+CD45RO-, making it a much more efficient way to gauge cells’ specificities. Multiplex immunofluorescence is a tissue-saving process compared to singleplex, as up to eight markers can be put onto a single slide. This method also allows for automated readout
Case Study: Using Multiplex Immunofluorescence for Colorectal Cancer
To highlight mIF’s benefits, data based on Royal Marsden’s process of biomarker identification for colorectal cancer (CRC) using mIF was presented. Across two panels, researchers at Royal Marsden performed a wide range of assessments, and specifically sought to include as many non-clinical standardised assessments which are still prognostically relevant as possible. Samples were taken from a cohort of 50 early-stage CRC patients. Stages I and II were combined (a total of 27 patients) and compared to Stage III (23 patients).
- Read: Oxford Global’s R&D Key 40 Stories 2022
- Discussion Group Report: Patient Engagement in Biomarker Development
- Aiding Clinical Qualification of Prognostics and Monitoring Biomarkers for Liver Cirrhosis
The pathological assessments looked at different advancing margins, tumour budding, peritumoral inflammation, and tumour/stroma ratio. Researchers assessed mismatch repair (MMR) deficiency and microsatellite instable (MSI) cases for genomics testing. Finally, tissue-based molecular and AI assessments included immunoscore, tumour infiltrating lymphocytes (TIL) assessment, T-cell subtyping, macrophage density and polarisation, and geospatial immune cell infiltration.
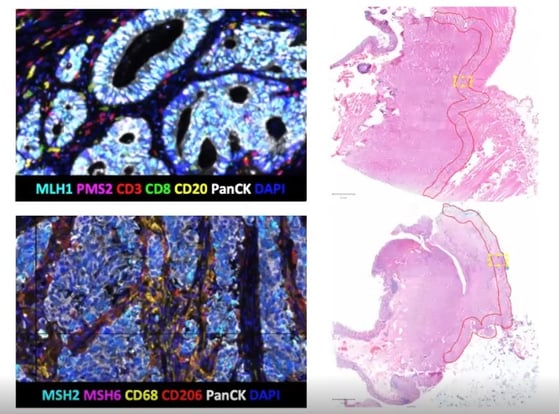
For MMR testing, it was highly significant that the four markers (MLH1, PMS2, MHS2, MHS6) could be stained and also offer a solid readout. Researchers found that in all 50 cases, the results obtained using mIF were the same as those from standardised clinical tests using four different singleplex IHCs. More MMR proficient cases were found than deficient.
Staining for the T cell subtypes CD3 and CD8, CD20, and PanCK allowed researchers to assess TIL levels. Overall, T cell density was ascertained by looking at CD3+ staining. It was possible to further subtype the T cells into T killer cells (CD3+CD8+), T helper cells (CD3+CD8-), and B cells (CD20). Figure 3 highlights how cell density is higher across all four subtypes in early-stage CRC compared to late-stage.
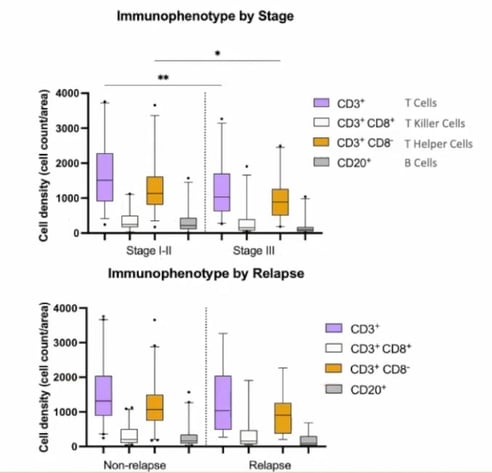
Relapse versus non-relapse cases showed a similar trend. However, it should be noted that there were only nine relapse cases within the cohort, meaning that the findings may not be statistically significant).
Immunoscore, which measures how well the body's immune cells surround and enter a tumour, assesses two locations of a tumour separately, the tumour core (CT) and the invasive margins (IM). In both locations, researchers looked at two different biomarkers for CD3 and CD8 and defined whether their presence was high or low. A high ranking for all four markers leads to an immunoscore of four, and a low ranking for all four markers gives an immunoscore of zero. Singleplex IHC assesses each marker separately, whereas mIF can perform the assessment simultaneously.
Royal Marsden’s assessment was described as an “adapted immunoscore” because there are no published thresholds defining high versus low rankings, so researchers had to define their own thresholds. Overall, they established the same trend as would have been achieved using other reference libraries, and it was unsurprising that early stages had higher immunoscores on average than advanced cases.
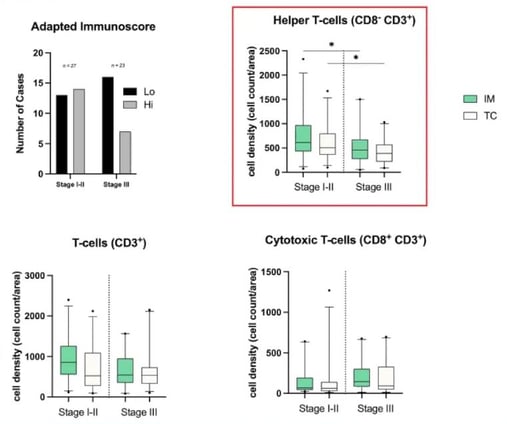
The results obtained by assessing different phenotypes are significant, as they suggest that mIF is more powerful than singleplex IHC and will be more valuable in the future. Whilst CD3 cells show the same trend in the CT and IM, it is interesting that cytotoxic cells (CD8+CD3+) show the opposite trend (see Figure 4). This may be because it is a combination phenotype.
However, the most striking combination was CD8-CD3+. The results showed that early stages of CRC had more T helper cells than advanced stages, and these results were also statistically significant.
Finally, the process to assess tertiary lymphoid structures (TLS), a combination of B and T cells, was discussed. TLS can be described in three stages:
- Early TLS (E-TLS), which is the colocation of some B cells and T cells.
- The primary follicle stage (PFL-TLS), where cells start organising with B cells moving towards the centre and T cells surrounding them.
- The secondary follicle stage (SFL-TLS), where there is a germinal centre in the middle with a mantle formed around it.
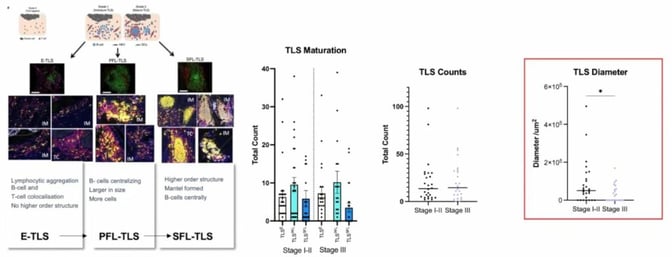
Results for TLS maturation and TLS counts were not particularly significant, as they appeared to be randomly distributed. More noteworthy was the diameter for SFL-TLS (see Figure 5). There was a significant drop between early and late stages, which reflects that the greater the diameter, the more likely it is to be early-stage CRC.
Clinical Integration
The discussion closed with an exploration of the steps that need to be completed before the clinical integration of multiplex immunofluorescence can be achieved. Currently, the process at Royal Marsden is research only. They will need to standardise the assay and equipment, standardise the analysis workflow, validate the process on a wider cohort, and re-assess standard procedures.
If researchers can complete these four steps and the standard procedure offers robust results, they will be able to move into national and international validation. The overall outlook seems to be positive, though, as many in the field are confident that this technology will become a part of clinical diagnostics sooner rather than later.
Want to read more about the applications of biomarker analysis in immuno-oncology? Visit our Biomarkers portal to stay up to date on the latest developments in oncolytics and therapeutics. If you’d like to learn more about our upcoming Biomarkers UK: In-Person conference, visit our event website to download an agenda and register your interest.